Monday, October 5, 2026
Welcome & What does El Niño mean for our Snow?
Hi all, welcome to the Cold Smoke Report! As an atmospheric scientist with a passion for skiing and snow, I've realized over the past few years that Southwest Montana is lacking a dedicated blog/site for snowfall forecasts. To start things off I'll be focusing on winter weather forecasts right here in the backyard at Bridger Bowl, Big Sky, and in Bozeman. Before I start with my first topic I've got a few ground rules and things I can promise for you all:
1) All forecasts will be written by a human, me. The full model/forecast and AI disclosure can be found on the "About" tab.
2) I will be wrong at times.
3) There are no bad questions, ask away.
4) This will always be a free community based resource.
5) I'll try to update as much as possible but can only promise a few posts per week during the season given the amount of time it takes to put together.
6) Oh and “Super” El Niño does not exist, scientifically speaking; I know it's semantics in terms of terminology but just so you all know :)
More than anything, though, I’m hoping this can be an educational resource for our community to better understand weather and science in general, including myself. With that, let's get into it!
I've probably either gotten the question or heard at least a hundred times this summer and fall, what does this El Niño mean for our snowfall? I thought that this will make for a good first post.
Unless you've been living under a rock, most folks know already that a record-strength El Niño is taking shape in the Pacific. As of the Climate Prediction Center's (CPC) late Sept. discussion, the ocean's still getting hotter with the key Niño-3.4 region sitting at +2.2 °C, and the eastern Pacific already past +3 °C. The CPC now has a greater than 90% chance of a very strong event, and, a 75% chance of a historic one, exceeding the strength of any El Niño back to 1950.
So the question for anyone with a Bridger or Big Sky pass: what does a big El Niño actually do to our snowfall in this region? To dig a little deeper I aggregated 76 seasons of SNOTEL recorded data along with the CPC's Oceanic Niño Index. TLDR: El Niño historically tilts the odds against us.
The snowfall totals in this post come from the nearest Bridger Bowl SNOTEL record (Brackett Creek) that extends back to 1950 after including the nearby co-op station. I'm using the daily change in snow depth, measured once a day after the snow has settled. Bridger's snow report that most are familiar with almost always measures higher (typically by up to 40+%) due to higher frequency measurements and measurement board sweeps. Basically in the upcoming plots, don't compare these numbers directly against the snow report; the results are meant to be percentages of normal.
Scatter plot of El Niño vs. La Niña Snowfall
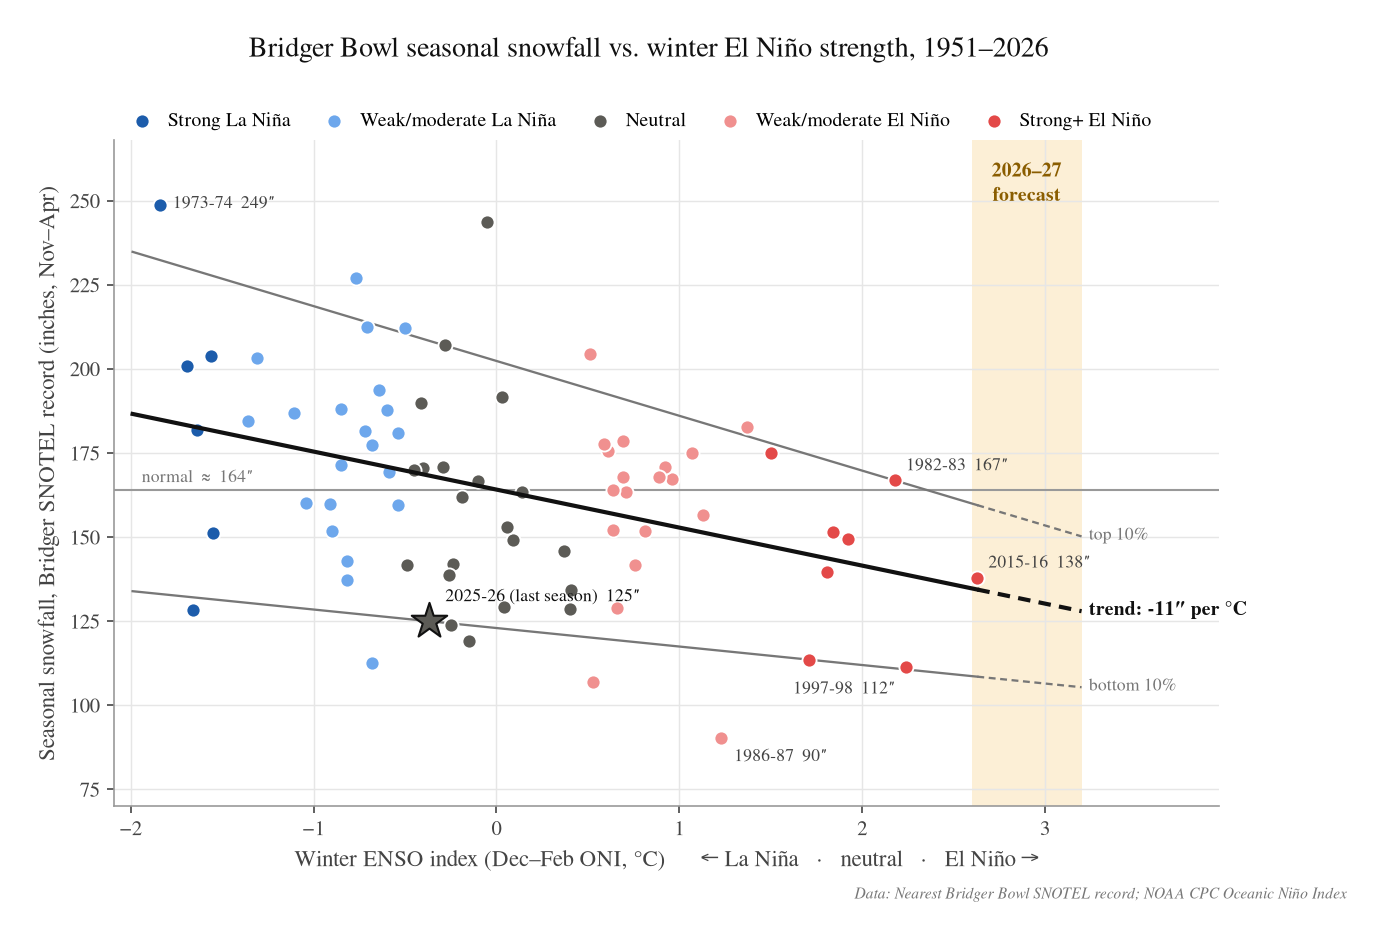
Over the past 76 winters, on average, seasonal snowfall decreases by about 11 inches per +1 °C of winter ONI at Bridger, the measure of El Nino's strength (more positive = stronger El Niño, more negative = stronger La Niña, -0.5–0.5 = neutral). It's important to note that despite the relationship, ENSO explains only part of the year-to-year variance. It does, however, in this case load the dice against us.
What's interesting to me is looking at where the loss is most prominent. In the plot you can see that the trend is steeper at the top of the range than the bottom: the biggest winters see a decrease of about 16″ per °C of El Niño, the driest about 5–6″. This indicates to me that while El Nino generally means less snow across the board, its bigger effect is on capping the ceiling. None of the eight strong El Niño winters since 1950 cleared 200 inches, while half of the strong La Niña winters did. Furthermore, though not shown here, looking at Bridger's top-20 biggest storm cycles on record, 11 landed in La Niña winters and just 5 in El Niño winters. TLDR is La Niña winters skew above normal in terms of snowfall ~2/3rds of the time, whereas zero of the eight historical El Niño winters had any more than a few inches above average.
Mean seasonal totals are 143″ for a strong El Niño → 158″ for neutral ENSO → 186″ for strong La Niña, compared with a 164″ climatological mean. You're probably asking what happened last year, wasn't that a La Niña? Sort of. ENSO quickly flipped to neutral early in the season, technically making it not a La Niña winter at least by these metrics.
Why El Niño's Pattern = Less Snowfall
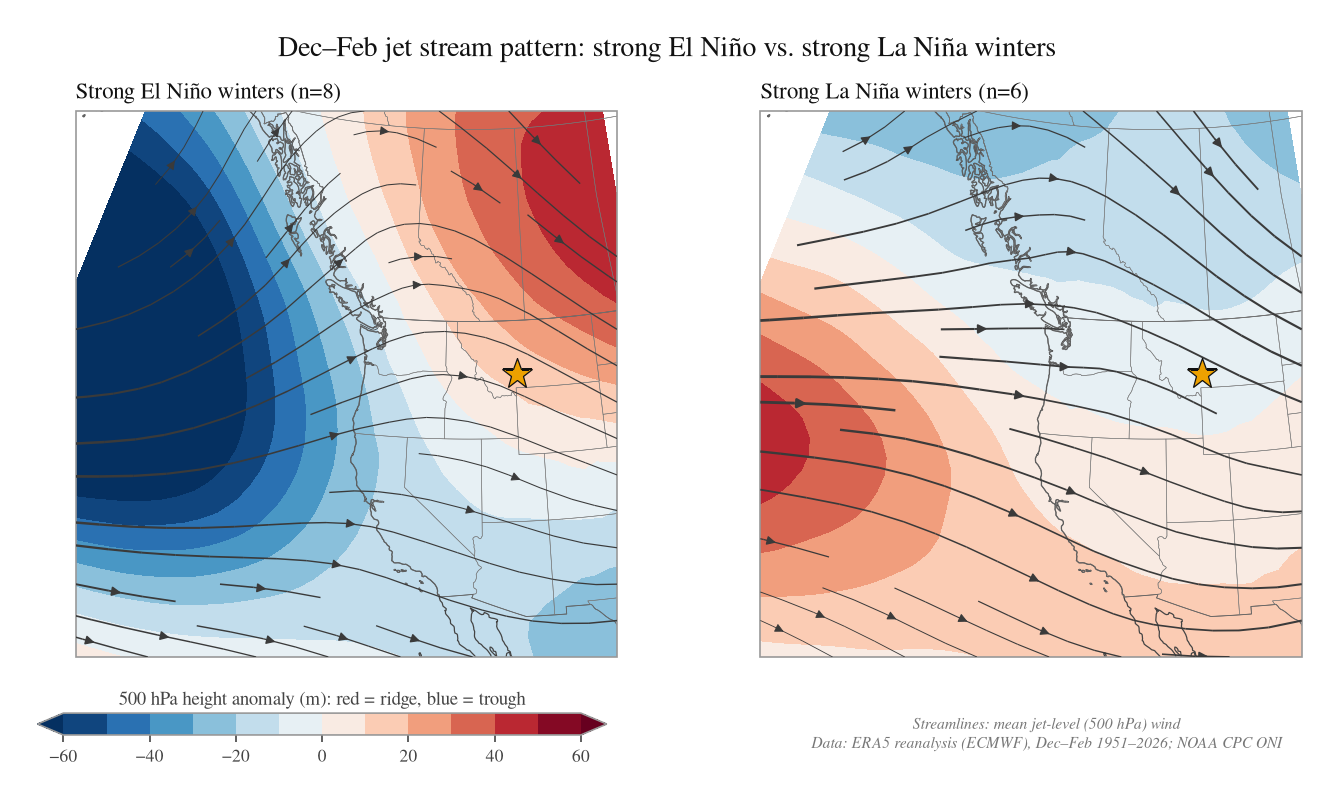
If we composite 76 winters of reanalysis fields, the pattern during strong El Niño's mid-winter has a deeper Aleutian low (dark blues off the Pacific NW) and also have more prominent ridging over western Canada to the northern Rockies over MT (notice the lines look like they form a mountain ridge with redder colors). This coincides with a storm track that tends to split and provides California with more precipitation than typical winters. Strong La Niña's, on the other hand, feature a North Pacific ridge and a trough digging into the Northwest, which leads to a favorable storm track from the W/NW for us.
Is there any good news in all of this? Well, Bozeman-area station records, reanalysis, and SNOTEL all seem to indicate that strong El Niño winters here are not reliably warmer with differences of only 0.1–0.6 °C. This result actually surprised me a bit. Historically, the warmest stretches globally come a few months after a big El Niño peaks, which is typically late winter into spring. The year after previous major events (1998, 2016, 2024) have tended to set a new global temperature record, however, that signal seems much weaker for our local climatology.
So what does 2026–27 look like?
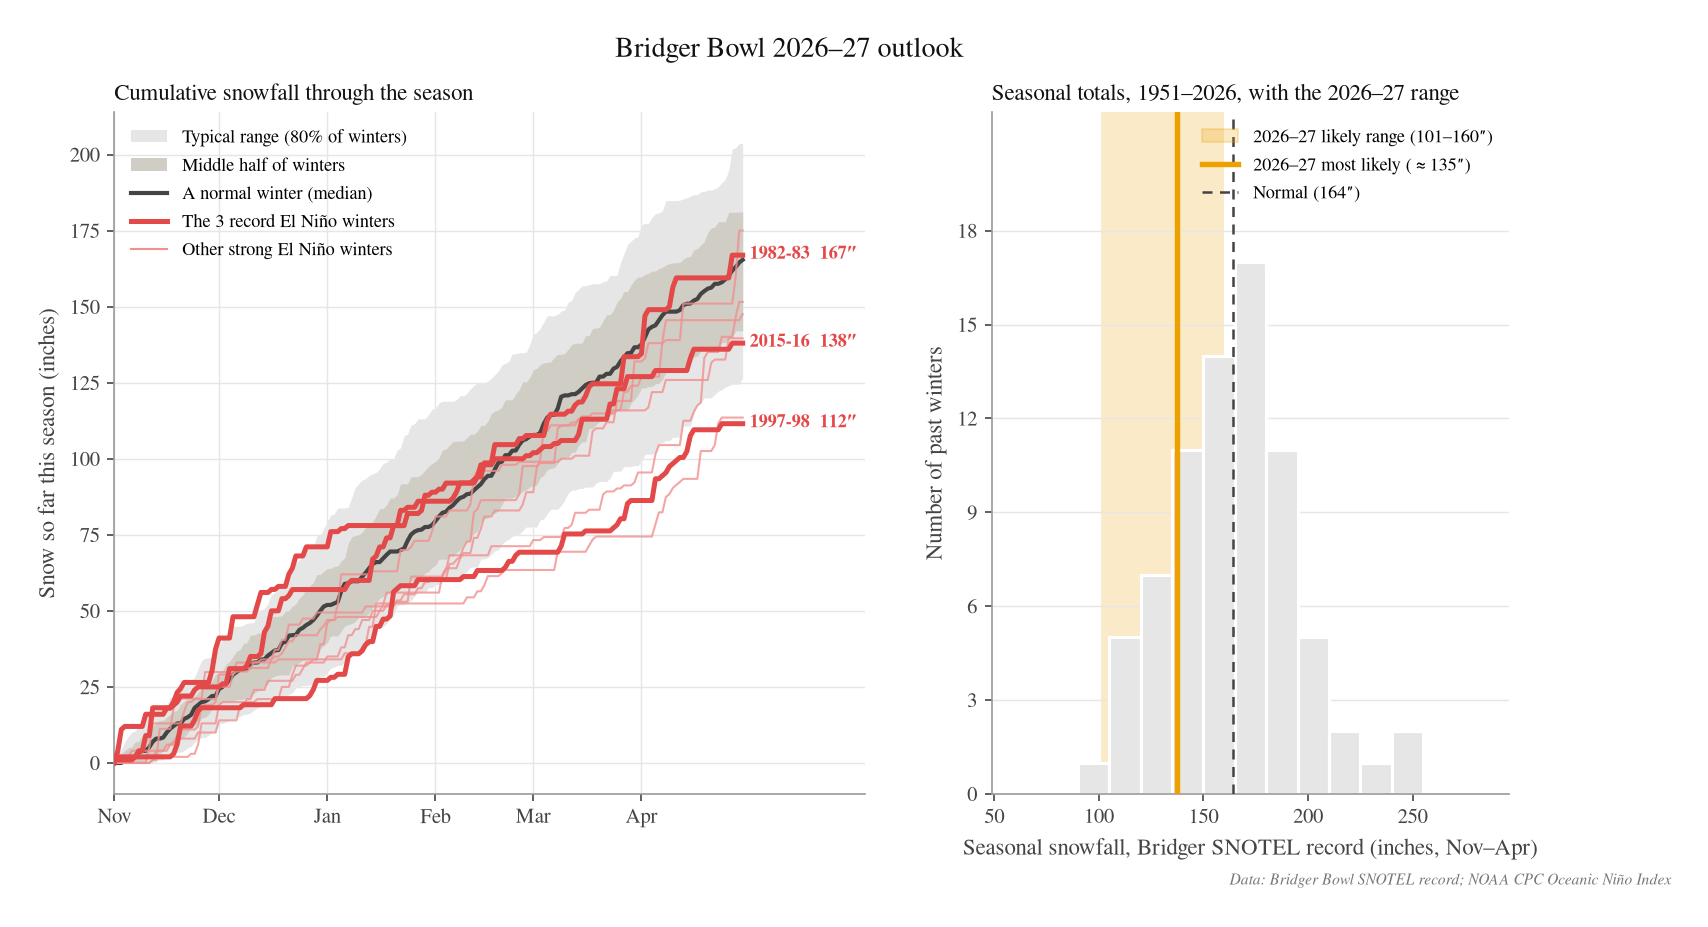
Our three very-strong analog winters (DJF ONI ≥ 2.0) are 1982-83, 1997-98, and 2015-16, which had 167″, 112″, and 138″ at Bridger respectively (remember these are the snotel numbers and would correspond to ~ 233, 157, and 193" for Bridger's direct measurements). This is a pretty wide spread and ranges anywhere from a decent winter near average to a dry one similar to last season. So here are what the numbers are telling me in summary: ~80–90% chance of finishing below the climo mean, and only ~10–15% chance of an above average season (*insert Jim Carrey meme*). Basically, I'd suggest tempering expectations, but I don't think all hope is lost!
A couple of disclaimers:
- The strongest winter ENSO in the record is 2015-16 at +2.63, and this year's forecast sits there or above. If the El Niño is above CPC's historic threshold, we don't have anything to compare it to.
- ENSO still explains only part of a winter here in SW MT. The other parts are the polar jet, storm luck, and whatever the North Pacific decides in February. 1982-83 was a big time El Niño and was still near climatology.
What about Big Sky?
The story is pretty similar down the road at Big Sky. The record there for the Lone Mountain Snotel is shorter (only goes back to 1992), but the ENSO relationship is, if anything, a touch stronger: about 14 inches lost per +1 °C of winter ONI, and the relationship explains a larger share of the variance than at Bridger.
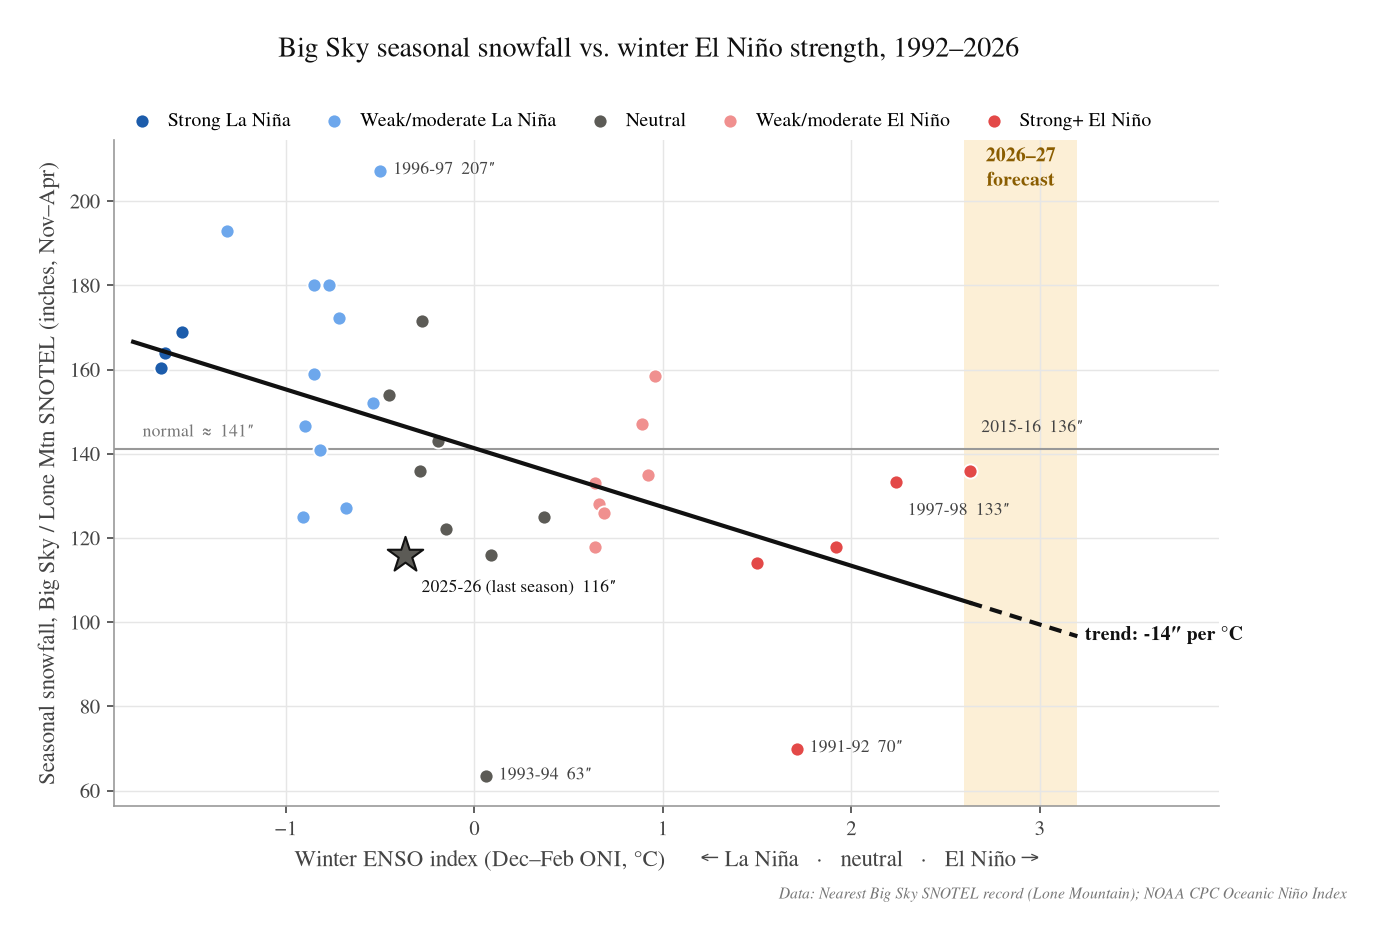
Compared to a normal of about 141 inches at Lone Mountain, the strong-El-Niño winters on record averaged roughly 114″ (about 80% of normal); however, the two closest very-strong analogs, 1997-98 and 2015-16, both were near 95%.
Bottom line
Expect fewer big storm days, but I wouldn't completely write off the season.
The snow that does fall should still be cold, since there's no reliable temperature signal here with El Nino, and it all comes down to the storm track.
CPC's next update is on October 8. I'll continue to provide updates leading into the season.
Pray for snow. And taking a quick peek at the forecast for next weekend we may have our first ❄️ to discuss! More soon and thanks for reading!
-Trey
*Methods: DJF Oceanic Niño Index (CPC), 76 usable Bridger seasons (Nov–Apr totals) from the Brackett Creek SNOTEL record (extended to 1950 with the nearby co-op station). Composites are reanalysis anomalies. The 2026-27 outlook centers on a forecast ONI of +2.9 (ranging 2.6–3.2) and CPC's >90% very-strong probability. ENSO status from the CPC ENSO Diagnostic Discussion issued 2026-09-10 and CPC's weekly update of 2026-09-28.*